Technical analysis: Falling prices
Do you want to use the technical analysis to trade successfully? In this section you will learn how to achieve satisfying returns by using the technical analysis for the bitcoin value.
We decided to take a investigate the price of bitcoins. The bitcoin value continued to fluctuate throughout the morning. By the beginning of the afternoon the blue line crossed the red line. When this happens, it represents a break in trend. In short: the value of bitcoin may change direction. As there is a clear break in the trend, you can choose to speculate on a fall in the price of bitcoin. Suppose you open a short position around 7 am.
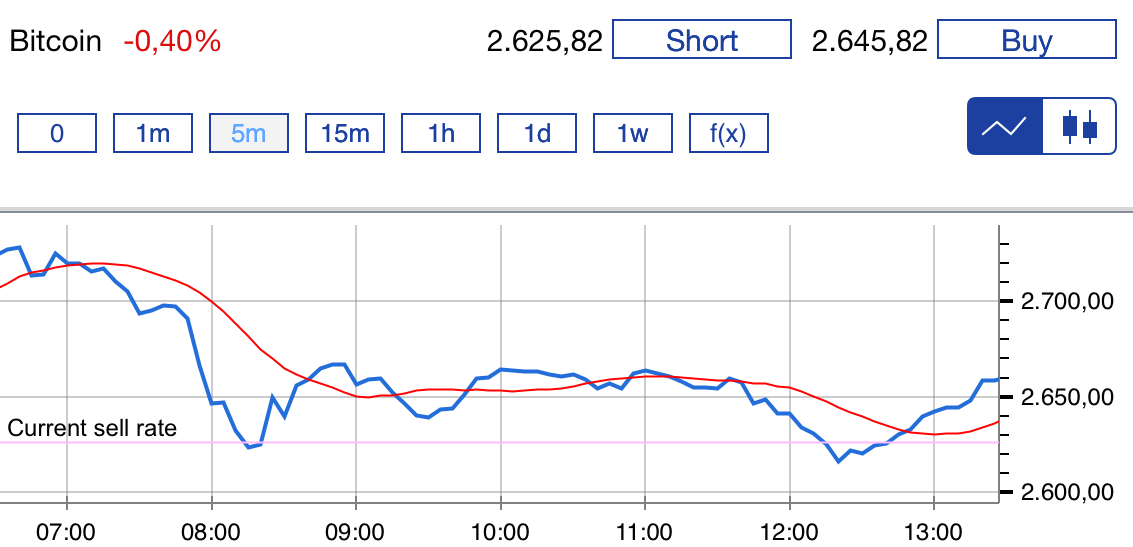 Figure 1: Investing in bitcoins –Value of Bitcoins decreasing
Soon after the value drops and you could have made a profit. In the next hour the blue and red lines cross multiple times, but there is still a clear downward trend. You can choose to wait to see if the profit you would make grows. After 1 pm, the blue and red line cross again, signifying a new break in the trend. Based on this observation we would close the position.
The results of the technical analysis
As shown in the chart, 1 bitcoin at the time of opening is approximately £2710. With leverage of 1:20, you could have purchased 1 bitcoin for £135, making a profit within 6 hours.
This technique is of course not the only technique you can use. Ultimately, it does not guarantee a successful trading experience.
In the next chapter, you will learn how to manage the risks involved with trading online.