Making a profit by speculating on the bitcoin price: the technical analysis

Welcome to step 4 of the course “Investing in bitcoins”. In this chapter, you will learn a second strategy to successfully trade in bitcoins i.e. by using the technical analysis
4.1 What is the technical analysis?
The technical analysis is used to predict the market value by looking at patterns and trends in the graph. This may sound complicated, but it’s not. This chapter will explain some patterns and functions.
4.2 What patterns are there?
There are three general patterns:
- Rising rate
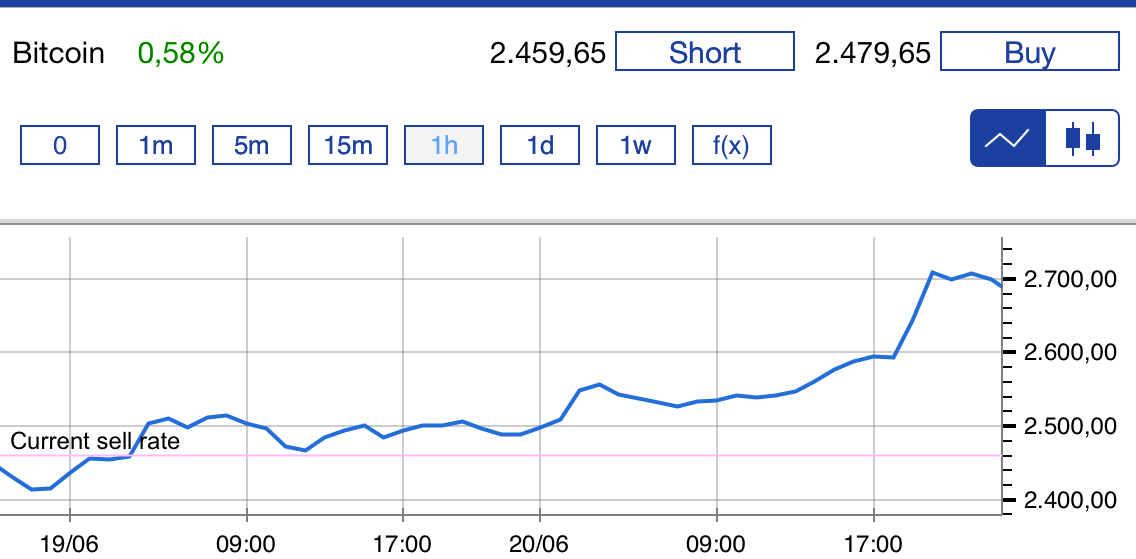
Figure 1: Investing in bitcoins – Rising price of bitcoins.
- Falling course
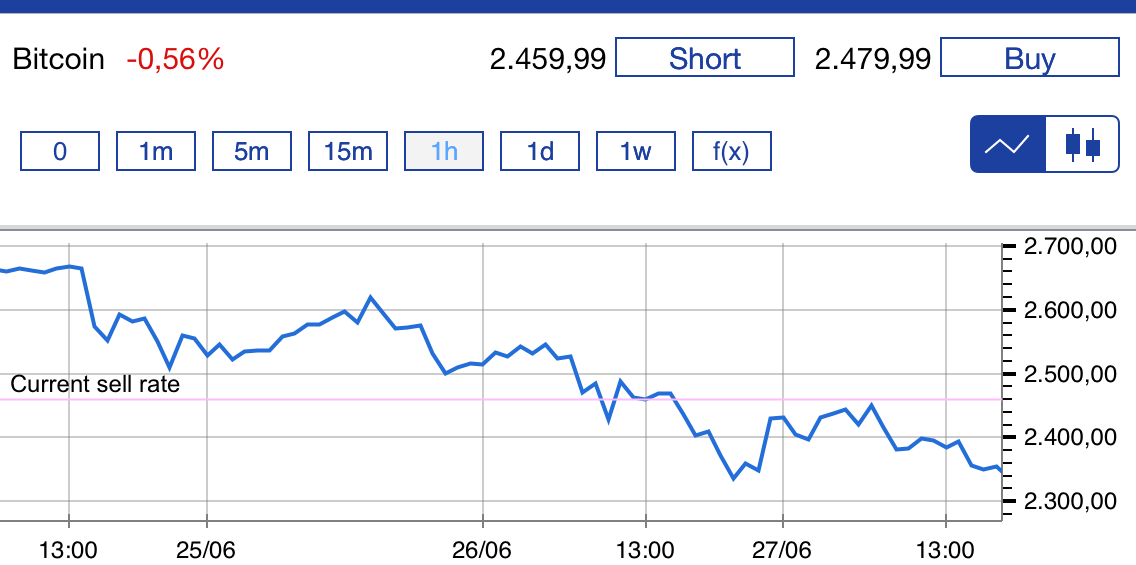
Figure 2: Investing in bitcoins – Falling price of bitcoins.
- Stable course
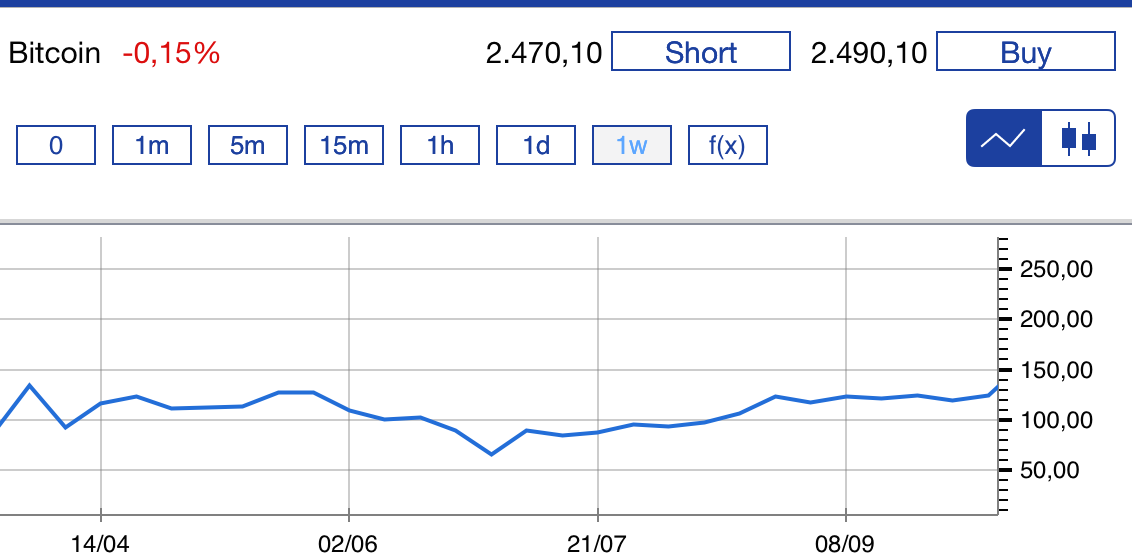
Figure 3: Investing in bitcoins – Stable rate of bitcoins.
4.3 What do you have to do?
If you notice a trend in the bitcoin rate, you can make a prediction on the future course of the bitcoin rate. You can open a position based on a prediction that the price will increase or that the price will decrease. In both cases, you can profit if your prediction is correct. This will be illustrated later in this chapter with a practical example.
4.4 Smart trading tricks: using indicators
There are two simple tricks that you can use to predict whether the rate will rise or fall. They are better known as indicators. They are comparable to a dashboard in a car. The more indicators that are illuminated red, the greater the chance that something will happen. Most brokers offer a variety of indicators for you to use at your disposal. The indicators are recognised on the graph as they are additional colourful lines.
The following two indicators are used most often:
- Moving Average or MA
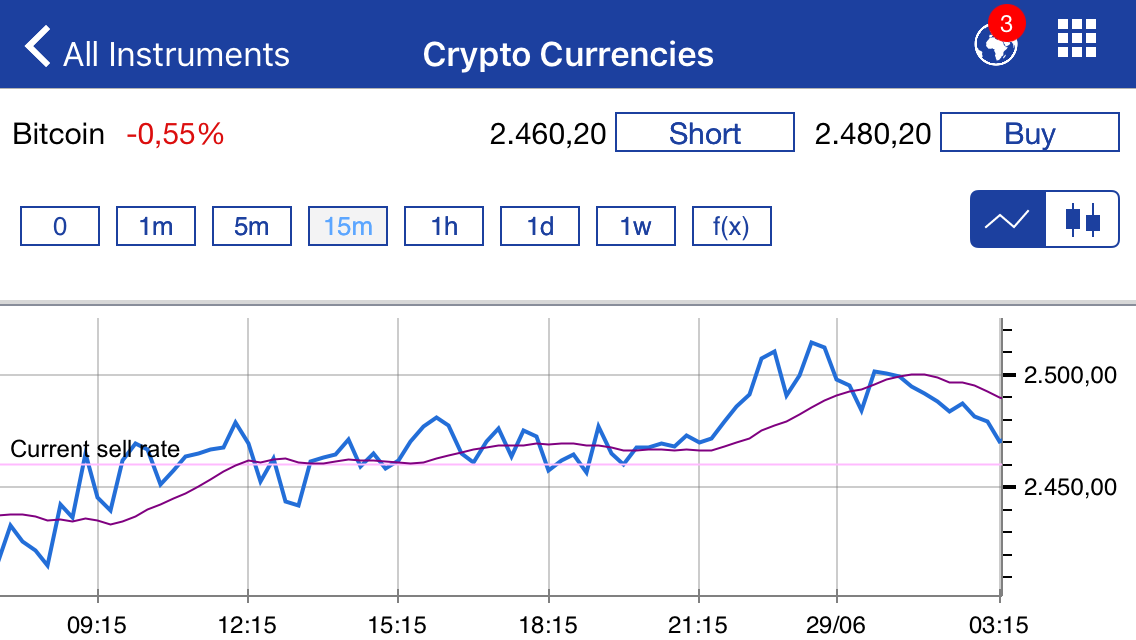
Figure 4: Investing in bitcoins – Moving Average bitcoins.
In figure 4 the moving average is the purple line. The idea is that when the purple line crosses the market value (the blue line), there is a high change that the direction of the course will change. We call this change a break in trend. When the purple line is falling, there is a change that it will begin to increase when it crosses the market value. If the purple line is rising, it is likely it will begin to drop following a break in trend.
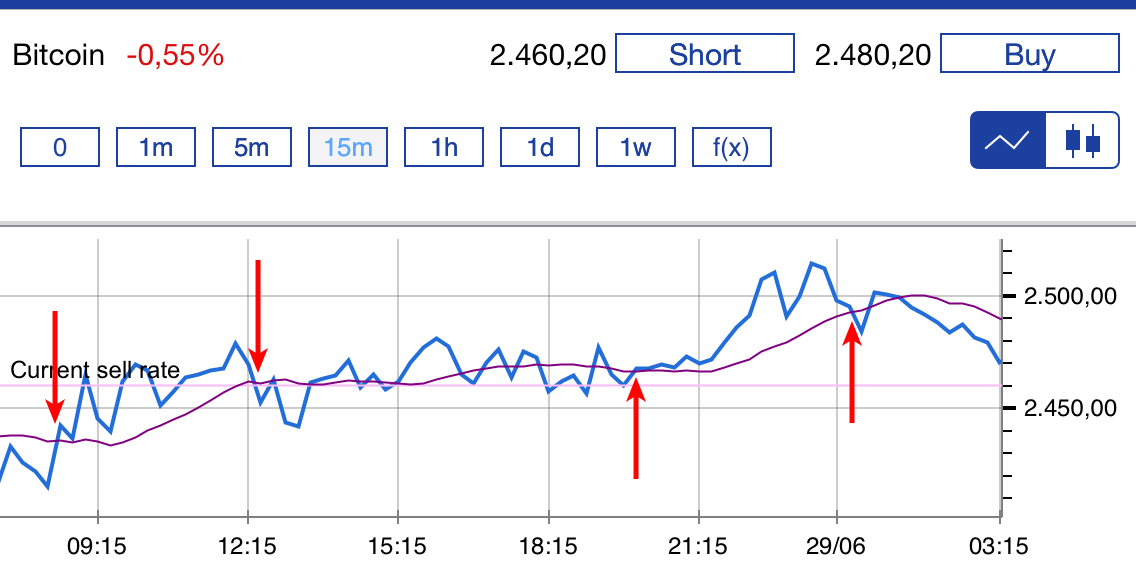 Figure 5: Investing in bitcoins –Moving average bitcoins.
- Bollinger Bands
Figure 6 shows the second indicator: the ‘Bollinger bands’. You can recognise this indicator by its olive green colour on the chart. The theory of this indicator is that when one of the outer beams reaches the bitcoin value, the bitcoin price can change direction. The graph shows a couple falling rates. If a break in trend happens, there is a chance that the bitcoin value will increase in these moments. You can also see that when the bitcoin value is increase, a break in the trend line tends to be followed by the bitcoin value decreasing.
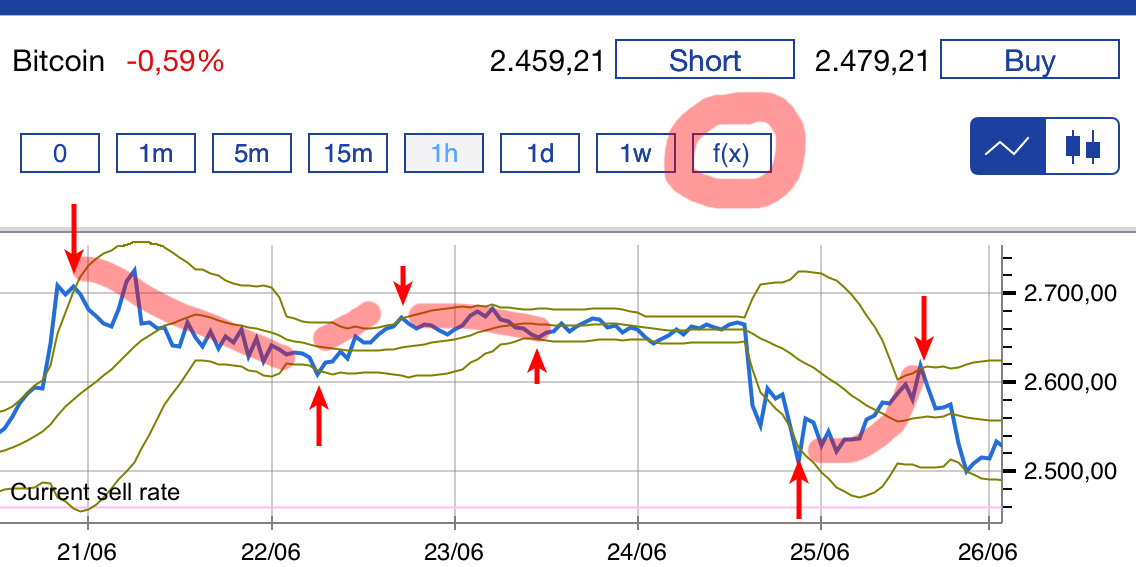 Figure 6: Investing in bitcoins –Bollinger bands bitcoins.
To show you how the technical analysis works, we have added a practical example for you. Do you want to read an example of how we made profits from a rising rate? Then click here.
Click here to read an example of making a profit from a declining bitcoin price.
In the next chapter, you will learn how to manage the risks whilst trading on bitcoins.